Do you provide market insights services to real estate agents?
If you build real estate market evaluation tools for agents or the public, this article aims to show you how you could leverage ARLAS. ARLAS is our solution for developing robust geoanalytics solutions to augment your service and guarantee your end users like real estate agents, reliable market insights.
While most evaluation tools can show you the average property price area of interest, most solutions do not answer specific questions or give historical sales information on particular properties like:
- What is the average price per square metre in my area of interest for say, apartments only?
- How many buildings of a certain size were sold in my area of interest during a specific period?
- If one wants to buy an independent house of about 100 spm under 350,000€, where should they start looking?
- What are the trends in pricing? Are they rising, stagnant or falling?
These, and other market insights are easy to derive from ARLAS. We explore some of them below in this article.
We have integrated real estate transactions data from the French Open Data platform captured above. This open dataset encompasses detailed information on property transactions across diverse regions in France.
We focus on data from Haute-Garonne (south west of France) to illustrate ARLAS’s excellent capacity to enrich real estate market assessments as highlighted below. The data we select captures transactions between January 2014 to November 2023. Nearly a 10 year period that can allow us to carry out in depth historical exploration. During this period, we have over 300,000 transactions to explore.
In ARLAS, we unearthed additional valuable insights that cannot be extracted through conventional approaches from the government platform.
Query #1 : Imagine that your client has just moved into the region and has no specific location demand, but give you their budget, size and type of property that they are looking for. Like, an independent house of about 100 spm for under 350,000€ in any neighbourhood in Toulouse.
Where should I start looking?
As you can see in the map below, some neighbourhoods have less to offer for our search. This quickly gives a clue on where to concentrate your efforts.
Query #2: How many apartments of a certain size were sold in my area of interest during a specific period? In our exploration below, we query the month of July for the years 2021, 2022 and 2023. We can then compare the results from the different periods to break down the aggregated data from the source.
We focus on houses with a surface between 110 sqm and 125 sqm in Toulouse. We see that the average price in 2021 and 2022 for roughly the same surface area, about 112 m2 around €4400 per square metre. 2022 is slightly higher by 70 Euros per square metre. The price per square metre drops by about 400 Euros per square metre in 2023. This means that the house that was going for about 500 thousand Euros in the two previous years, has lost a market value of about 50 thousand Euros.
Query #3: A seller wants to know how to price their property. They seek a benchmark for their offer. For example, how many properties of a certain price range were sold in my area of interest during a specific period?
Let’s try a search of the number of houses in the Tournefeuille area with prices ranging between €380,000 and €440,00 , in the 2O22. We end up with 38 houses averaging €658 per square metre and can see the spread of the price evolution per square metre over that year.
ARLAS facilitates these exploration and analytics in a simple and fluid manner.
Query #4
Say you want to offer a view of pricing trends of a given area: Have prices gone up? Down? Are they static? ARLAS also facilitates this analytics from the historical data, going as far back as the data recorded.
In this case we explore Balma. We see that even though there is a slow down in transactions. The price per building’s square metre has barely changed in the last 10 years, compared to Rouffiac-Tolosan, a neighbourhood just around the corner from Balma.
Links to results
ARLAS also allows you to filter based on a perimeter tied to a point of interest. In the example below, we choose a school in Balma as our point of interest. We then set a radius of two kilometres and explore the number of houses sold in the last two years. We can even highlight the latest transaction to get more details.
ARLAS’s analytics capacity supports unlimited exploration of all the dimensions present in the data. As long as the data carries the information, you can extract it to enlighten your clients on:
- How to price their property
- What they can get for their budget
- When to take advantage of the market
And even nuggets of insights like which neighbourhoods have fewer ownership succession, a sign of satisfaction.
Fun facts!
According to this data, most transactions are carried out on Fridays! Why? Maybe to go into the weekend in celebration.
It is interesting to see that some of the deals took place over the weekends. Because, albeit small, some transactions took place on Saturdays and even Sundays!
And, July and December take the top spots for highest transactions. Real estate agents will tell you that most families in France opt to move in July as the onset of the summer school break allows them to settle in before a new school year. Why December? Something to investigate.
Let’s talk
You already know that tools can’t completely replace human sentiments and experience, but it sure does help to back your counsel with data. With ARLAS, your real estate analytics solution could be more versatile, offering in depth analysis to your clients.
If you have other data sources that you would like to explore alongside property transactions data, please get in touch with us to discuss this. ARLAS’s offers you the valuable advantage of drawing from diverse sources of data.
Other Posts

Gisaia and Survintel Announce Strategic Partnership
Gisaia and Survintel Announce Strategic Partnership to Advance Ground Deformation Monitoring for Predictive Maintenance Gisaia and Survintel have entered into a strategic

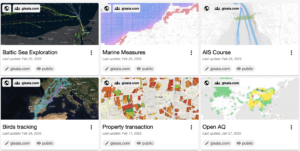
WELCOME TO ARLAS-BUILDER
build interactive dashboards for Geospatial Analytics ARLAS-Builder is a comprehensive studio environment that we specifically designed for the creation and customisation


